Reconstructing the history of founder events using genome-wide patterns of allele sharing across individuals
- PMID: 35737729
- PMCID: PMC9223333
- DOI: 10.1371/journal.pgen.1010243
Reconstructing the history of founder events using genome-wide patterns of allele sharing across individuals
Abstract
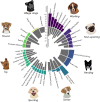
Founder events play a critical role in shaping genetic diversity, fitness and disease risk in a population. Yet our understanding of the prevalence and distribution of founder events in humans and other species remains incomplete, as most existing methods require large sample sizes or phased genomes. Thus, we developed ASCEND that measures the correlation in allele sharing between pairs of individuals across the genome to infer the age and strength of founder events. We show that ASCEND can reliably estimate the parameters of founder events under a range of demographic scenarios. We then apply ASCEND to two species with contrasting evolutionary histories: ~460 worldwide human populations and ~40 modern dog breeds. In humans, we find that over half of the analyzed populations have evidence for recent founder events, associated with geographic isolation, modes of sustenance, or cultural practices such as endogamy. Notably, island populations have lower population sizes than continental groups and most hunter-gatherer, nomadic and indigenous groups have evidence of recent founder events. Many present-day groups--including Native Americans, Oceanians and South Asians--have experienced more extreme founder events than Ashkenazi Jews who have high rates of recessive diseases due their known history of founder events. Using ancient genomes, we show that the strength of founder events differs markedly across geographic regions and time--with three major founder events related to the peopling of Americas and a trend in decreasing strength of founder events in Europe following the Neolithic transition and steppe migrations. In dogs, we estimate extreme founder events in most breeds that occurred in the last 25 generations, concordant with the establishment of many dog breeds during the Victorian times. Our analysis highlights a widespread history of founder events in humans and dogs and elucidates some of the demographic and cultural practices related to these events.
Conflict of interest statement
The authors have declared that no competing interests exist.
Figures


Similar articles
-
Human genetic data reveal contrasting demographic patterns between sedentary and nomadic populations that predate the emergence of farming.Mol Biol Evol. 2013 Dec;30(12):2629-44. doi: 10.1093/molbev/mst156. Epub 2013 Sep 24. Mol Biol Evol. 2013. PMID: 24063884
-
Contrasting patterns of Y chromosome variation in Ashkenazi Jewish and host non-Jewish European populations.Hum Genet. 2004 Mar;114(4):354-65. doi: 10.1007/s00439-003-1073-7. Epub 2004 Jan 22. Hum Genet. 2004. PMID: 14740294
-
The promise of discovering population-specific disease-associated genes in South Asia.Nat Genet. 2017 Sep;49(9):1403-1407. doi: 10.1038/ng.3917. Epub 2017 Jul 17. Nat Genet. 2017. PMID: 28714977 Free PMC article.
-
Founder mutations among the Dutch.Eur J Hum Genet. 2004 Jul;12(7):591-600. doi: 10.1038/sj.ejhg.5201151. Eur J Hum Genet. 2004. PMID: 15010701 Review.
-
The population genetics of the Jewish people.Hum Genet. 2013 Feb;132(2):119-27. doi: 10.1007/s00439-012-1235-6. Epub 2012 Oct 10. Hum Genet. 2013. PMID: 23052947 Free PMC article. Review.
Cited by
-
How size and genetic diversity shape lifespan across breeds of purebred dogs.Geroscience. 2023 Apr;45(2):627-643. doi: 10.1007/s11357-022-00653-w. Epub 2022 Sep 6. Geroscience. 2023. PMID: 36066765 Free PMC article.
-
Genome-wide data from medieval German Jews show that the Ashkenazi founder event pre-dated the 14th century.Cell. 2022 Dec 8;185(25):4703-4716.e16. doi: 10.1016/j.cell.2022.11.002. Epub 2022 Nov 30. Cell. 2022. PMID: 36455558 Free PMC article.
-
Deciphering the genetic structure of the Quebec founder population using genealogies.Eur J Hum Genet. 2024 Jan;32(1):91-97. doi: 10.1038/s41431-023-01356-2. Epub 2023 Apr 4. Eur J Hum Genet. 2024. PMID: 37016017 Free PMC article.
-
Demographic and Selection Histories of Populations Across the Sahel/Savannah Belt.Mol Biol Evol. 2022 Oct 7;39(10):msac209. doi: 10.1093/molbev/msac209. Mol Biol Evol. 2022. PMID: 36173804 Free PMC article.
-
Indigenous people from Amazon show genetic signatures of pathogen-driven selection.Sci Adv. 2023 Mar 10;9(10):eabo0234. doi: 10.1126/sciadv.abo0234. Epub 2023 Mar 8. Sci Adv. 2023. PMID: 36888716 Free PMC article.
References
-
- McKusick VA. Medical Genetic Studies of the Amish: Selected Papers. 1978.
Publication types
MeSH terms
Grants and funding
LinkOut - more resources
Full Text Sources

